
I don't like writing technical model documentation and, generally, I find people don't like reading it. This is a chore for both of us. It's also exactly the type of circumstance that screams loudly for an engaging metaphor. So let's do that first.
The Obstruction Point Procrastination (Part 1)
This is about a poorly considered effort to get from 'here' to 'there.' So, it's the 1940s and we're in the Olympic mountains (my home turf). We are on Hurricane Ridge and we want to get to the upper terminus of Deer Park Road—a point lying about 7 miles east as the crow flies. To do this, we need to build across a mile-high ridge composed of varying types of rock. Sure, it's an ambitious challenge, but think of the payoff—a breathtaking mile-high ride across a rugged landscape that leaves your brain buzzing with blues and greens. Let's call this moment of departure, 'The Now.'
In this 'Now,' the future looks bright mostly because we want it to look bright. You don't deploy sizeable resources and energy expecting to fail. Failure is a risk, but the doing of anything—whether building a road or a business—is firmly grounded in the expectation of success.
What happens next to our road is the exact opposite of success. It is a highly educational, partially avoidable failure born from letting what we wish for replace what is actually real.
Lesson 1: Don't be lazy and just let "Now" be what you want it to be. Do your homework.
The Obstruction Point Procrastination (Part 2)
Okay, back to building this road. It's early summer. The heavy equipment is rolling. First, bulldozers and crawler tractors. Next, cable-operated power shovels. Then, motor graders and dump trucks. Add this to our hard work, hand tools, and dynamite, and we are blasting our way into the future. In fact, we manage to carve eight miles of road. It's a twisting, narrow, harrowing eight miles of road, but still, it's 'road.'
I'm sure you've already figured out that Obstruction Point comes next. This is where everything grinds to a halt because building roads on shale, broken sedimentary rock, and scree is a terrible idea. This is where a rather nondescript mini-peak of little initial concern gets a stubbornly enduring name and winds up looming over a small parking lot and a lonely pit toilet which, in the heat of summer, will make your head swoon.
Planners didn't properly evaluate the geological foundation of the entire ridge line ahead of time. Now we have a half-ass, single-lane, axle-rubbing thrill ride. Locals planning to start a hike at Obstruction Point down into Grand Valley know they need plans A, B, C, and D. Plan A is the original hiking plan. Plan B is what you'll do if the road is closed when you get there. Plan C is having extra food, water, and patience if you find yourself on the wrong side of someone else's vehicle breakdown. And Plan D is what you're going to do if your vehicle is the one gumming up the works.
In short: Obstruction Point Road is a road holding many uncertain futures. A quality modeling system treats the economy the exact same way.
Which brings us to Lesson Number 2: We often tend to see the future in a singular way—as a target we either hit or miss. That's a mistake. The future is a fluid idea with many possible shapes. To fixate on just one leaves your model not just vulnerable, but nearly always wrong.
The Obstruction Point Procrastination (Part 3)
There's one last lesson, Lesson 3, to winch out of this car gobbling metaphor: Being wrong can lead to new, unexpected opportunities. A forecast gone wrong can be the beginning of a new thing gone right. The poorly planned road project we started working on together is a thing of the past, but the effort wasn't totally in vain. It became a lesson. What was once our future became our past, and then the future kept going.
The new 'Now' values the preserved landscape of Olympic National Park. The Obstruction Point Road project ultimately produced a greater emphasis on saving a pristine wilderness and far less on drive-by tourism. While it's tempting to simply dismiss a forecast gone wrong, it is far better to reflect on why it missed and what might come out of it. 'Wrong' is also a valuable piece of information. A modeling system built with a healthy feedback loop can help tease out this value.
Okay, Let's Get Technical
The DataSkinny model has two fully integrated submodels. The first estimates current conditions, a process known as nowcasting. The second is a time-series forecasting model with a rolling two-year horizon. The two subsystems combined could, in terms of our road building exercise, be viewed as ridgecasting.
Nowcasting
To build an accurate picture of the current economic landscape (the 'Now' landscape of our metaphor), The DataSkinny model deploys a dynamic, multi-level Input-Output (I/O) system. The constraining layer is sector-based, corresponding roughly to three-digit NAICS categories. The second layer drills down into lines of business (LOB) or 'pure' industries (4-to-6-digit NAICS categories), where boundaries are defined strictly by primary output forms. This sector-level model governs the entire system: all data generated by the highly granular LOB portion is ultimately constrained by these overarching sector-level controls.
The sector-LOB hierarchy is structured around the frequency of rebenchmarking. Both the static and dynamic elements of the sector-level I/O model are fully updated every year. For the LOB layer, dynamic elements are updated annually, while static elements are adjusted on a staggered schedule—most are fully updated every five years. Ultimately, these fresh, annual sector-level static benchmarks ensure that the deeper, less-frequently-updated LOB parameters remain consistent and economically realistic.
What is Now?
While an Input-Output (I/O) model system provides a solid structural foundation for nowcasting, defining the temporal "now" remains a moving target. Traditional nowcasters rely heavily on standard, publicly available macro variables—such as the Federal Reserve Board's industrial production indexes or the Bureau of Labor Statistics' employment and inflation data. Nowcasting brings these lagging metrics into the present by mitigating reporting delays, accounting for subsequent data revisions, and patching the structural holes left by missing data (like during government shutdowns). High-frequency financial sectors often use similar methodologies to smooth out data friction.
The DataSkinny model starts with this traditional baseline, but our vision of "now" goes much further.
To see the difference, think back to the Obstruction Point road project. The approach there was simple and linear: We have heavy equipment, plenty of workers, and dynamite—so let’s dig. It gets the job done, but it completely misses the bigger picture.
The DataSkinny version of "now" doesn't just look at the blunt, heavy machinery of standard macro data. Instead, it dynamically transforms that data into decision-level variables. Think of these variables as the economic equivalents of geological surveys, infrastructure health, and real-time traffic flows. This gives you a comprehensive view of the risks and rewards behind any move. Ultimately, it ensures your business interests aren't left stranded miles from help by a sudden, easily foreseeable shift in the market. The DataSkinny model builds a wide, encompassing vision of "now."
The "Skinny" part of the model is how this expansive, complex picture is packaged and delivered. Instead of drowning you in raw data, the "Skinny" serves up targeted sets of standard data concepts alongside carefully crafted, theoretically defensible proxies—shining a light on the economic realities that usually hide in the shadows.
For example, let's say you sell ball and roller bearings and you want to increase your prices. Traditional nowcasting, at best, will give you a vague sense of whether or not a price hike has legs. The DataSkinny model, on the other hand, estimates how much each major end market is spending on ball and roller bearings as a share of total current account costs. It tells your sales team exactly who can absorb the hike or pass it further downstream, and shows precisely where demand is growing or stalling. In other words, it provides a decision-ready picture of "now."
Ex-ante Forecasting—Foundational Variables
Moving a wide, encompassing vision of "now" into the future is a heavy lift. In the DataSkinny model, there are over a half-million data concepts built around thousands of foundational, published indexes and indicators. Every single one of them must be pushed forward in time.
How do we do that? The process breaks down into a few key operations.
First, we recast our foundational variable models each month to find a new "current" version. We don't just pick one blindly; we look at a wide selection of "contender" models and subject each one to extensive backcasting. From this statistical battle, a single winner emerges as the new "current" model.
But we don't stop there. If we relied entirely on whichever model won this month, our forecasts would be incredibly volatile. Relying too much on the most recent data creates a lot of short-term noise.
To smooth out the ride, the new winner joins a pool of previous monthly champions. We fix that "jumpiness" by blending the entire pool together using a two-part voting system:
- Recency (Time Decay): Newer entrants to the pool are favored over older ones.
- Accuracy: Models with a proven track record of forecasting the most recent data points get a heavier vote.
By blending and normalizing these two weighting schemes, a stable, statistically defensible forecast emerges from the pool. The jumpiness vanishes, and our foundational models stay perfectly connected to the latest historical data.
But what happens when the world suddenly changes? To protect against major economic shocks, we add one final gatekeeper to the process. While blending our top contenders smooths out the noise, it could accidentally mute a massive, legitimate market shift. This gatekeeper’s job is to separate minor statistical blips from true game changers. If the data proves an event is a genuine structural shift, it’s allowed to bypass the smoothing filter so the forecast can react instantly.
Ex-ante Forecasting—Constructed Variables
To summarize, we use foundational variables to build the complex, decision-ready "now" we discussed earlier. First, we forecast those foundational pieces using the process we just covered.
Here is where it all ties together: the constructed, decision-ready variables move in lockstep with those foundational pieces. They are bound together using carefully crafted, theoretically defensible algebraic equations.
All of this lives inside an I/O-based model. Think of it as a two-layer system: a high-level, constraining sector layer, and a much larger line-of-business (LOB) layer filled with granular data. To keep the model accurate, that detailed LOB data must always match up and be rationalized against the parent sector layer.
So, how does that rationalization process work?
Every value in the forecasted LOB layer is matched to a parent value in the sector-level model. Almost always, several LOB values are tied to a single sector data point. To keep the model consistent, LOB values are normalized into percentage shares. Those shares then act like a dynamic blueprint, divvying out the overarching sector value.
This is a classic share model technique with a twist: these shares aren't fixed. They constantly adapt to shifting prices and demand. The result better reflects the vibrant micro-world living underneath the broader sector. Ultimately, it yields a well-behaved data system where DataSkinny's decision-ready variables are forced into strict, real-world alignment.
Ridgecasting
If you've gotten this far without being bored to tears, you're a better person than I am. As I said at the beginning, documenting this methodology is a chore. Thankfully, the messy question of how I do what I do is nearly cleaned up. What's left is the part where everything gets neatly tied together with a bow. For that, we need to head back out to the mountains—and back to the messy business of 1940s road building.
The Three Lessons Redux
Let's reintroduce the three lessons we learned when trying to build our highly scenic, car-gobbling, pit-toilet, cul-de-sac:
- Spend time really learning what "Now" is.
- The future is fluid. Don't make your forecast fit a desired outcome.
- Being wrong is feedback, not defeat.
These rules are simple to express but incredibly hard to execute. The art and science of knowing "now" through nowcasting requires a deep understanding of not just published data, but how that data is used—and how to package it to reveal both its usefulness and its limitations. We can know a lot about the present, but we can't know everything.
Drawing a straight line between where we are today and a stubborn "want," and then calling it a forecast, is the exact recipe for a debacle—like the Obstruction Point Road project. Forecasts must reflect the underlying uncertainty that justifies their very existence.
That is the exact ethos behind the DataSkinny forecasting approach. By focusing on foundational variables, uncertainty isn't simply acknowledged—the DataSkinny model actively works to mitigate it. Forecasts will never be perfect. But when they're built right, they’re robust enough to keep your strategy, and your entire enterprise, out of history's dustbin.
Expensing the Gas
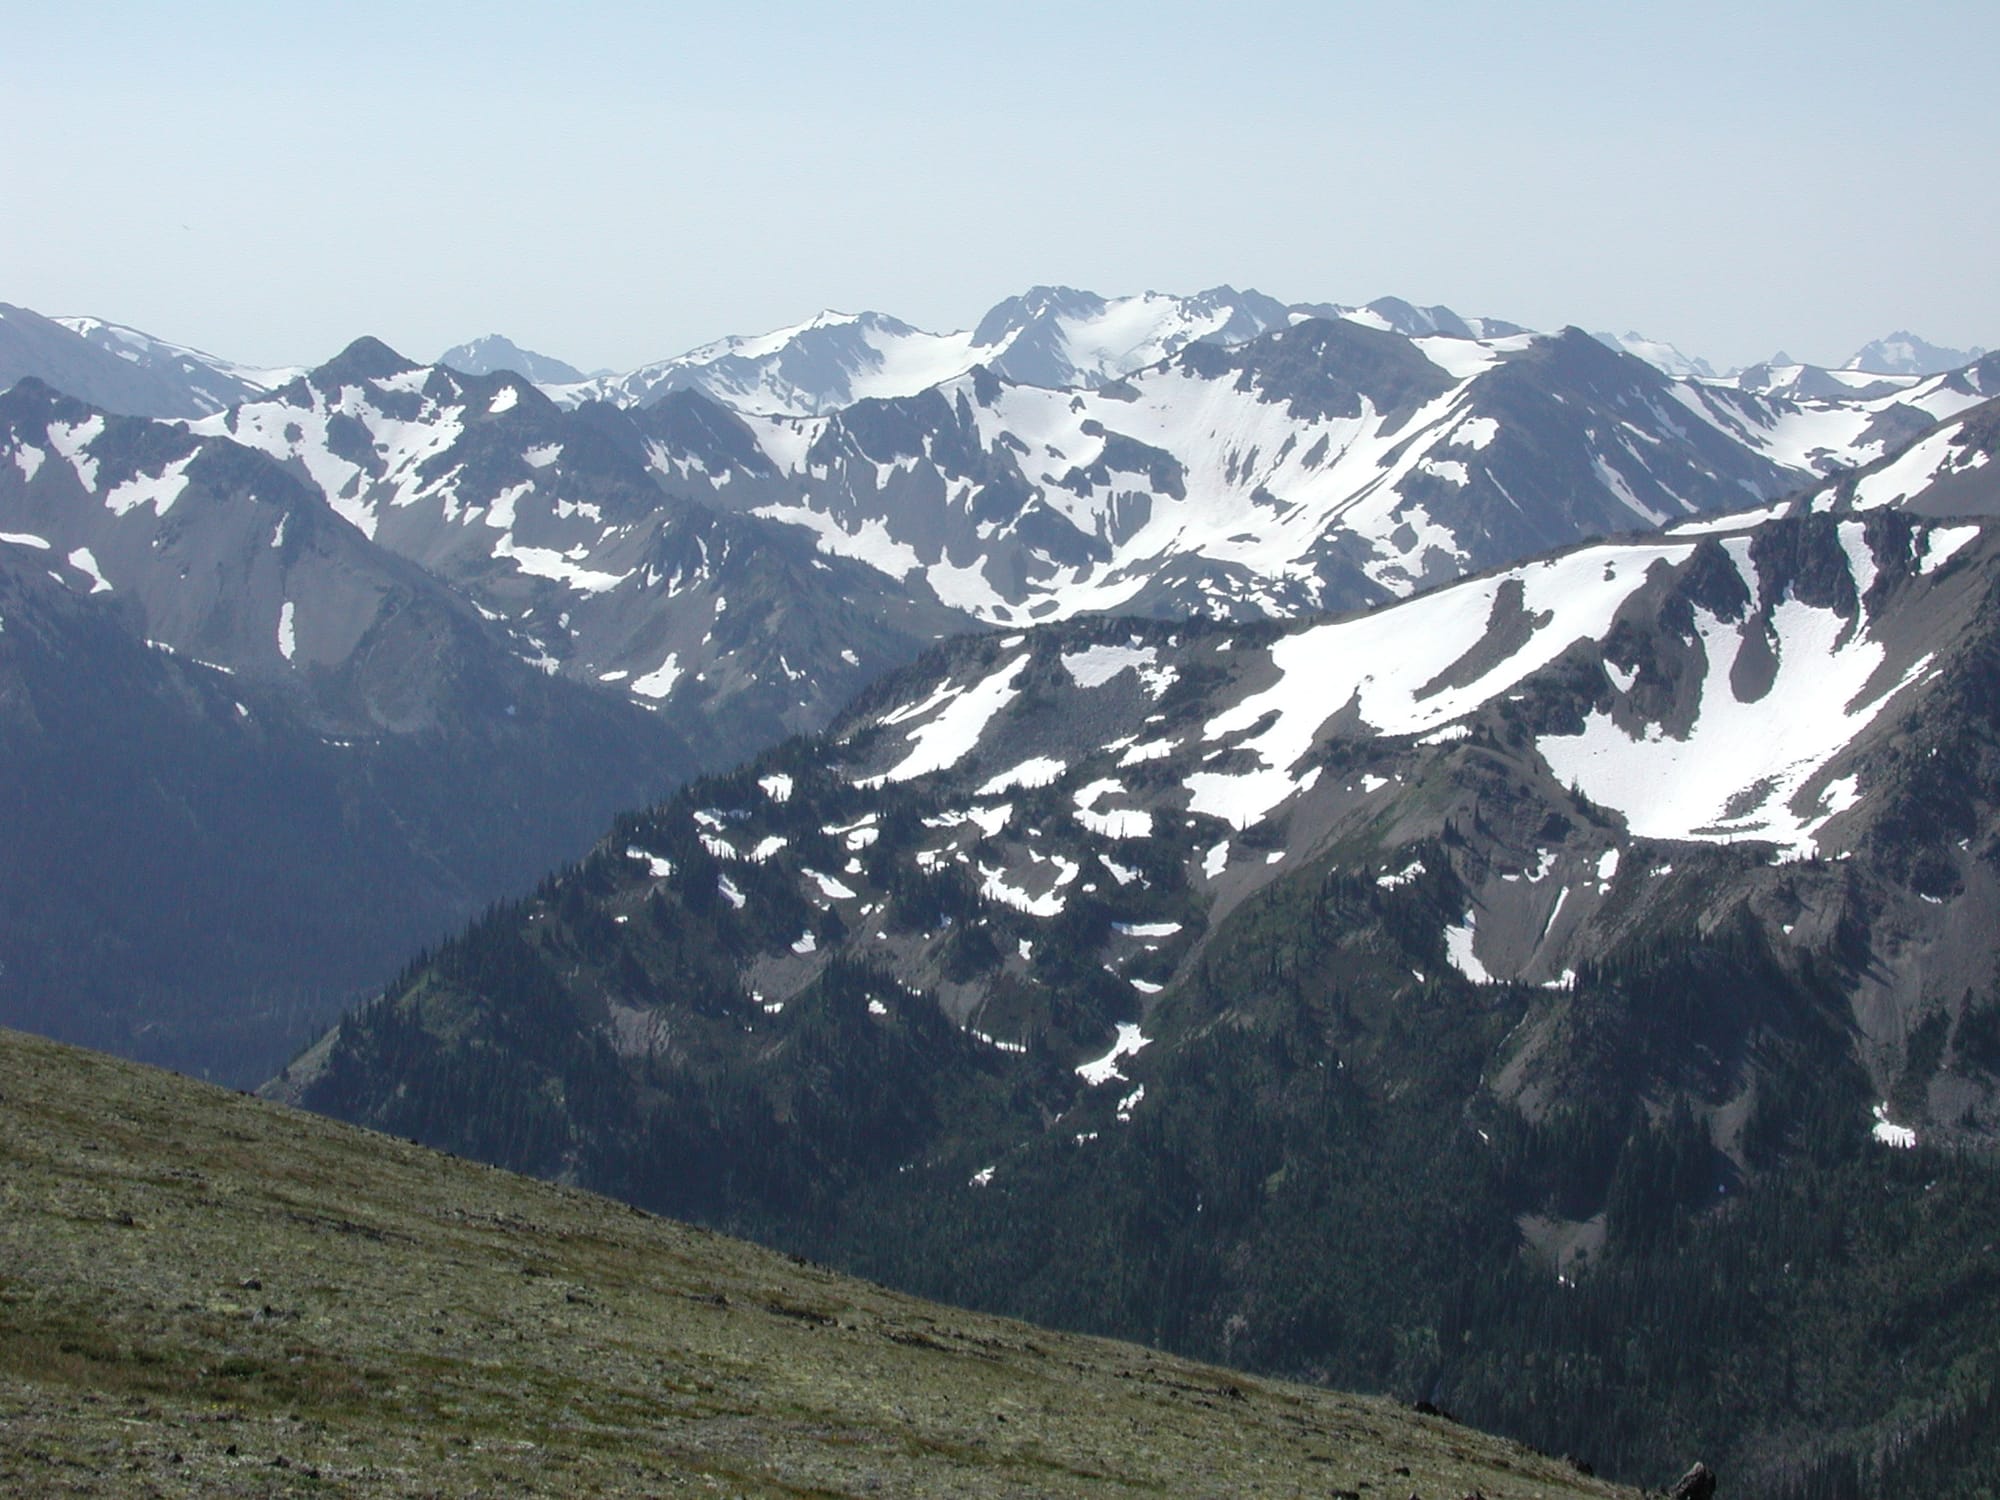
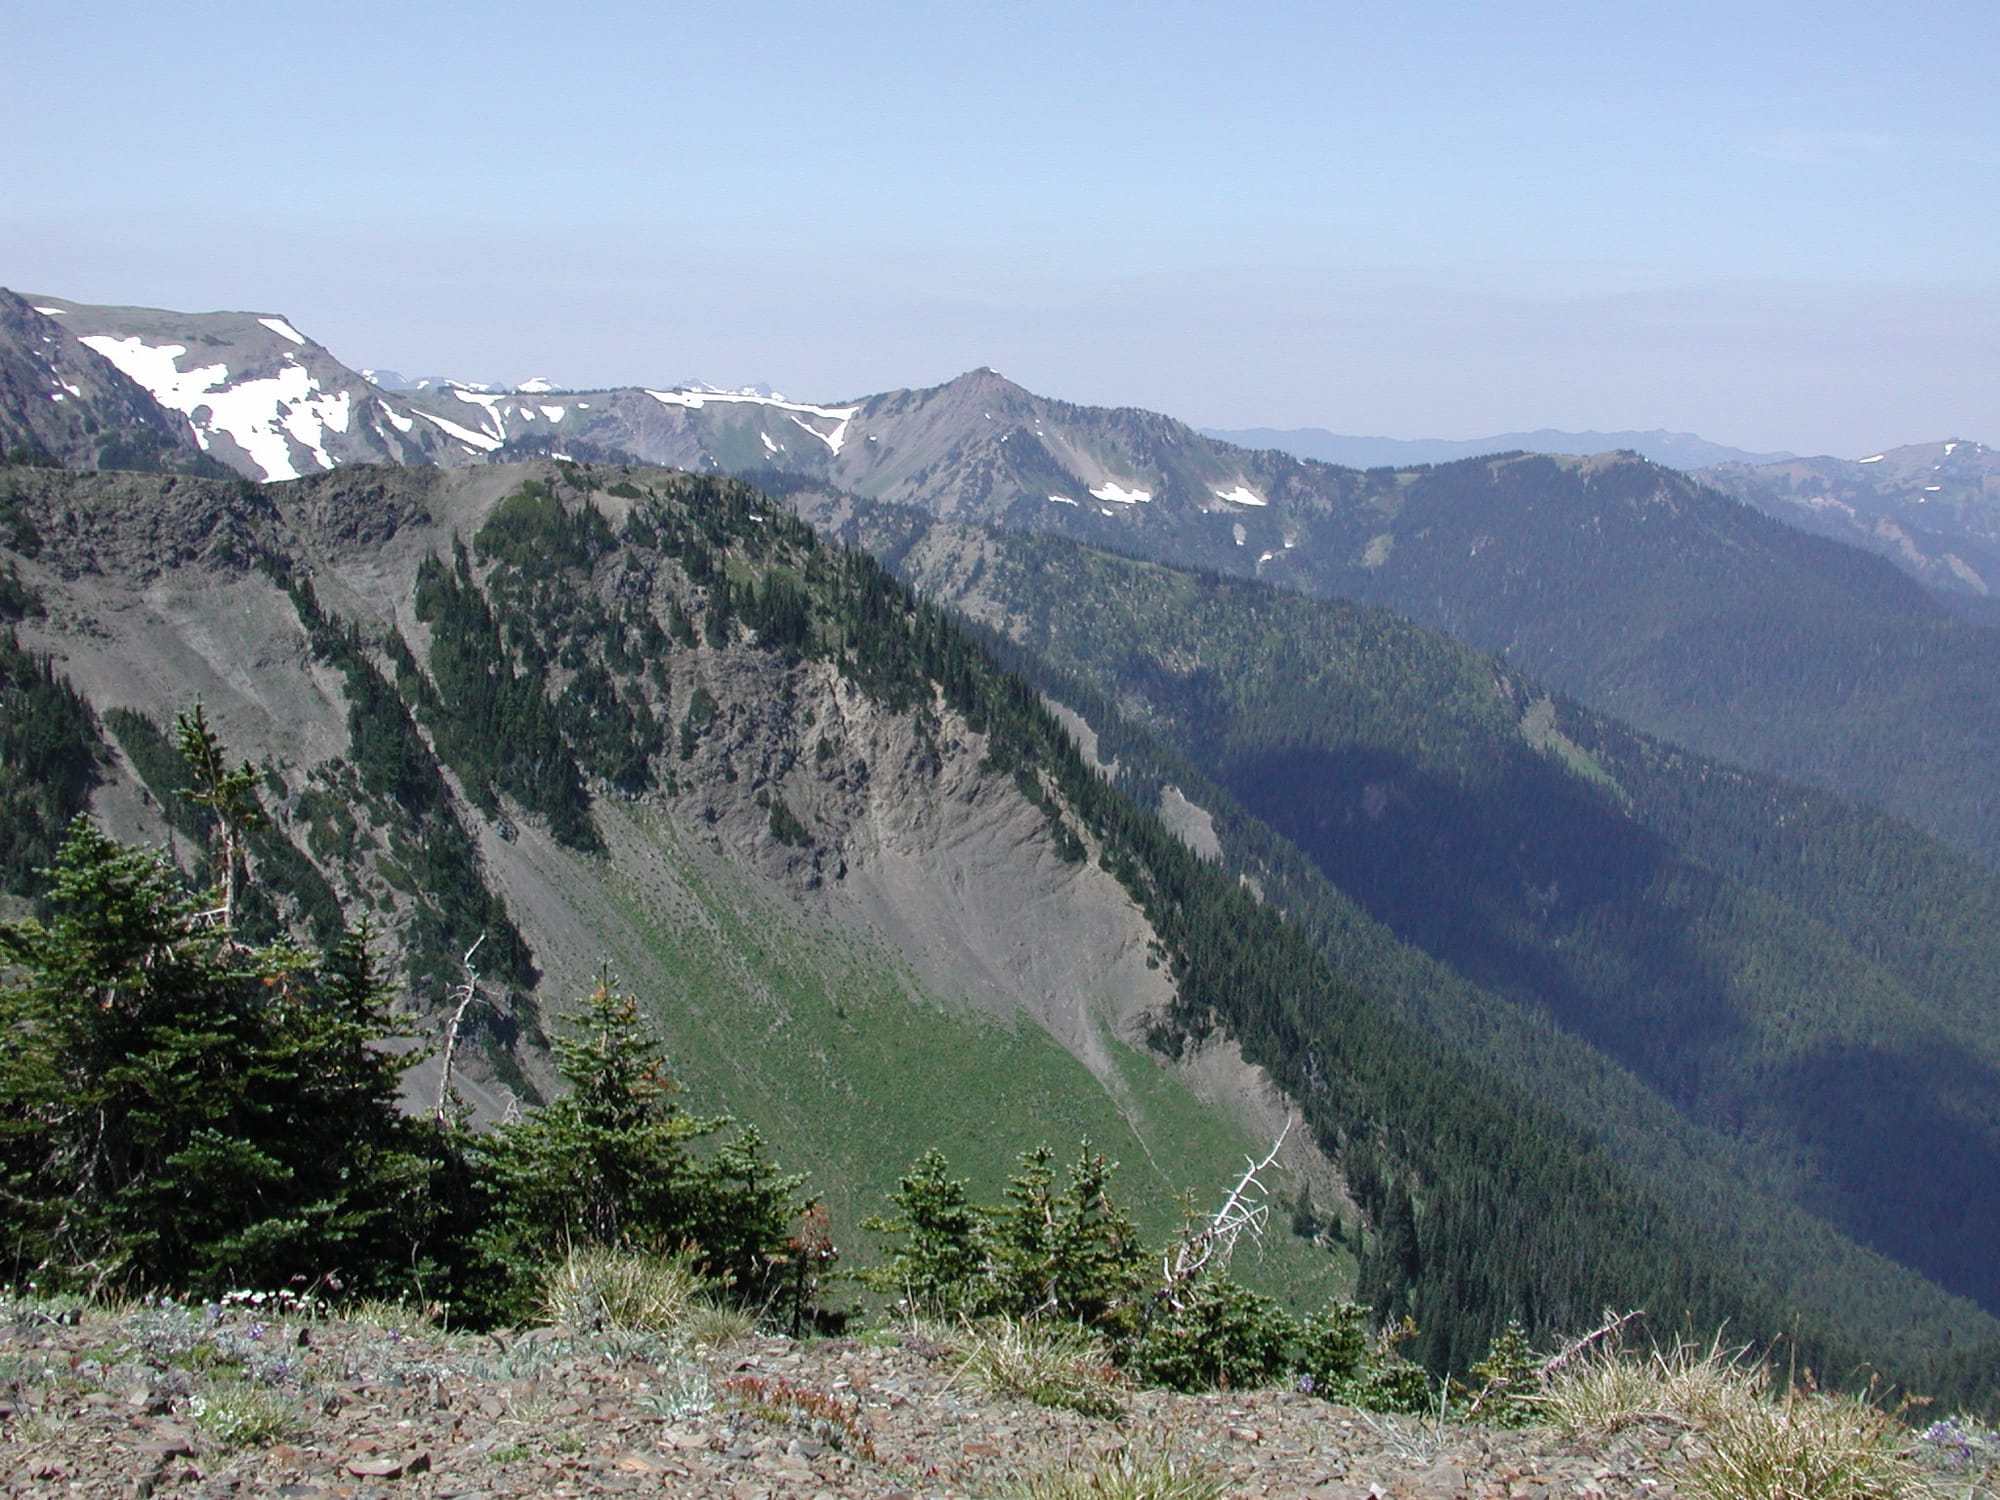
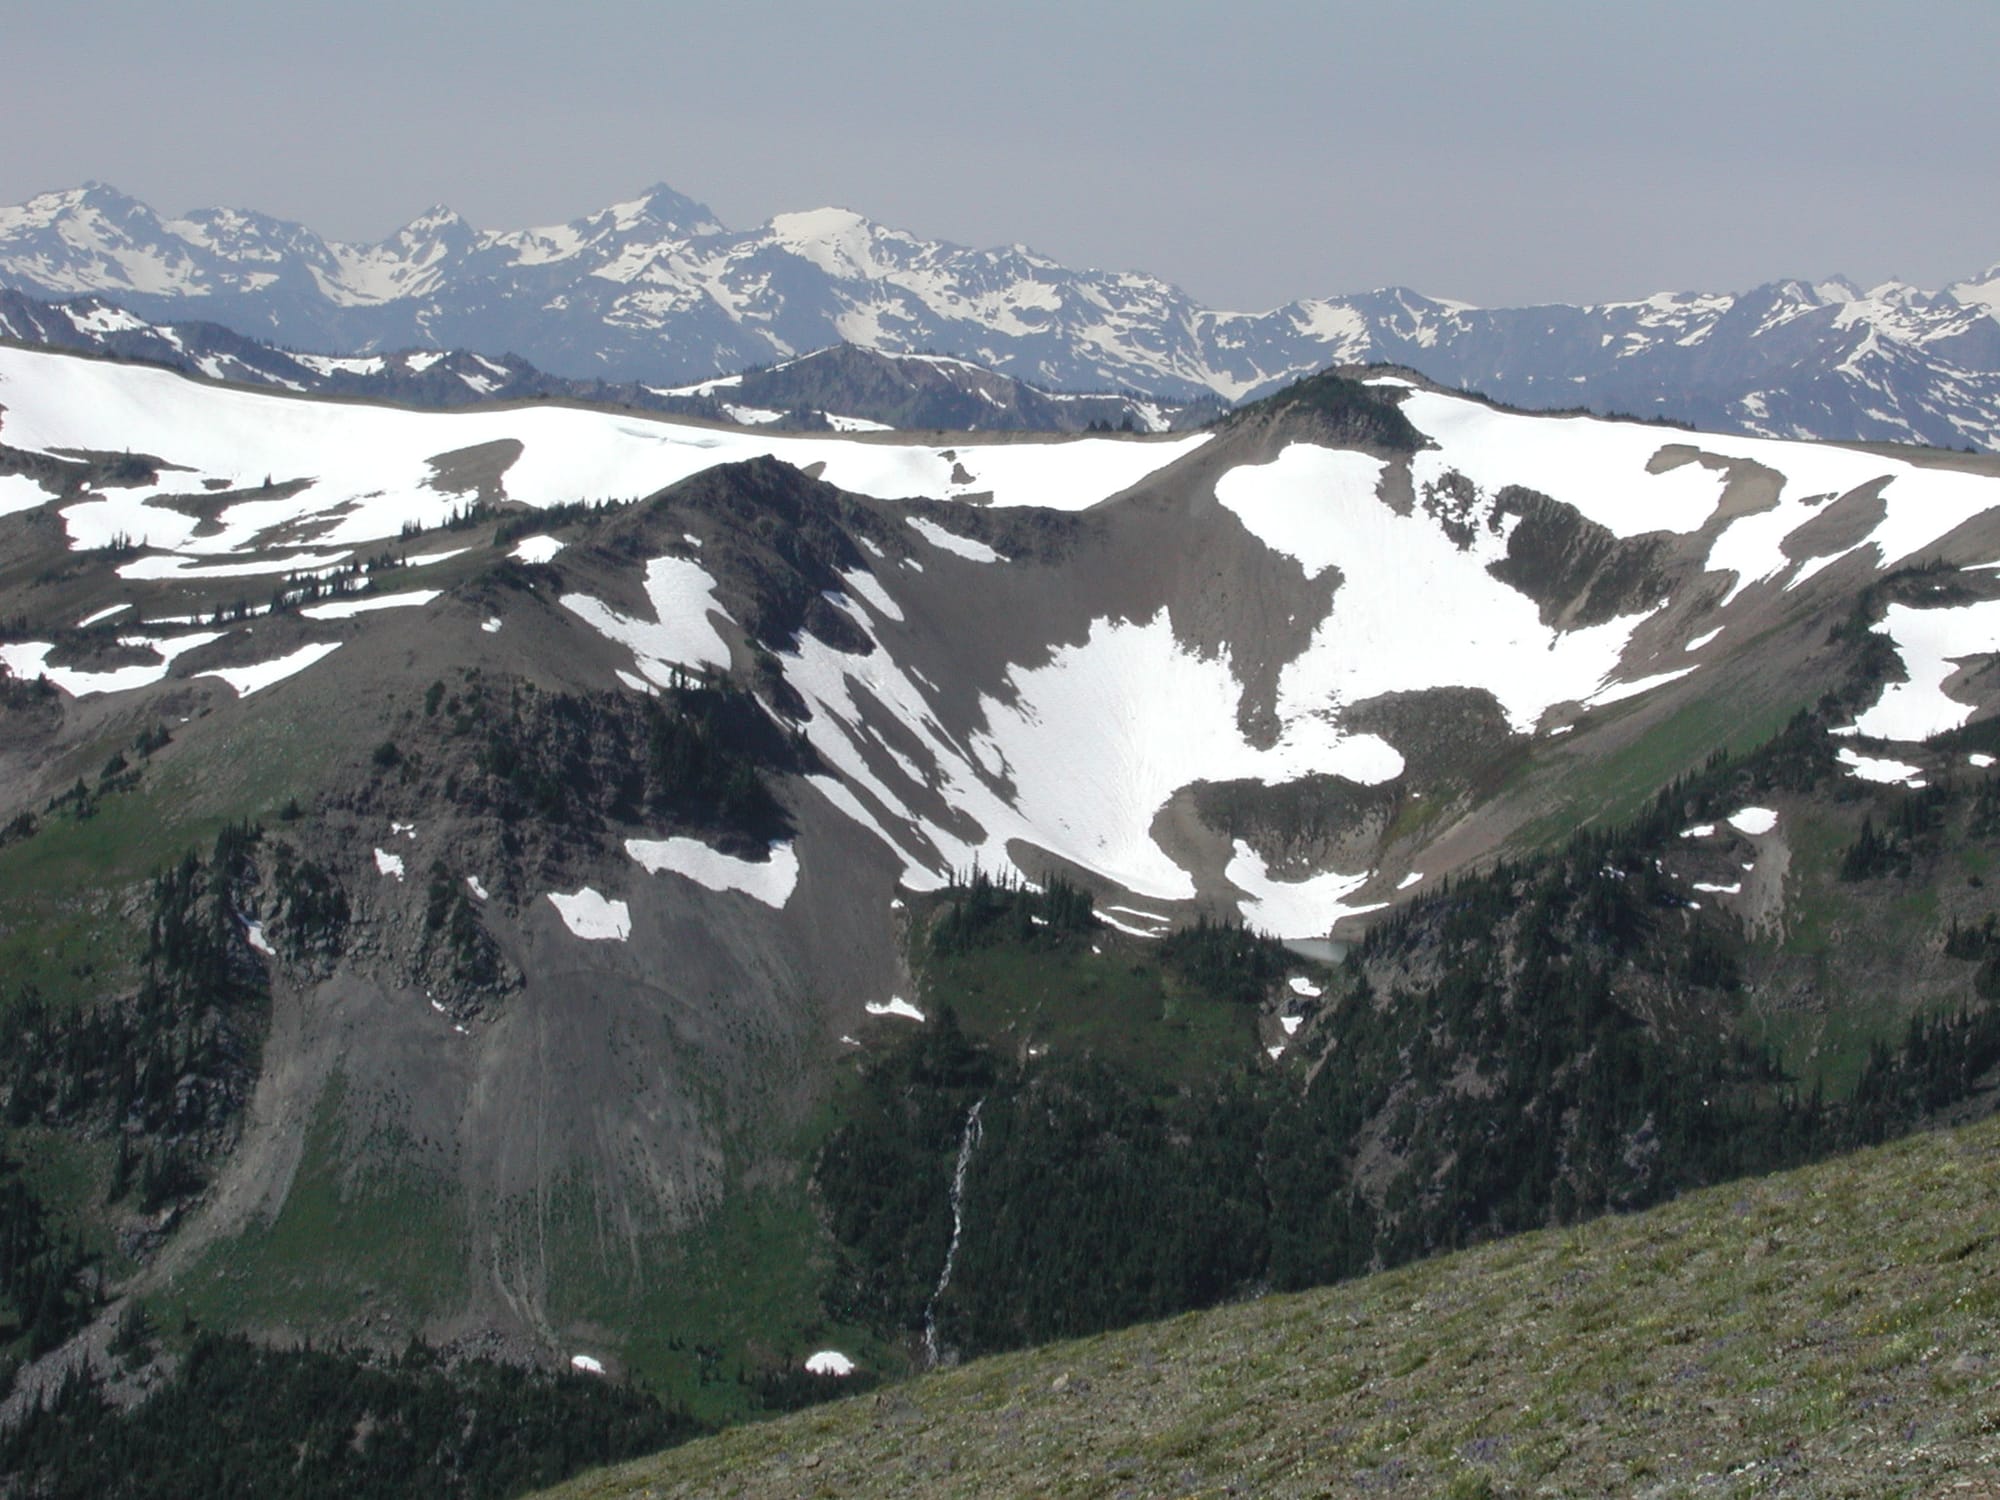
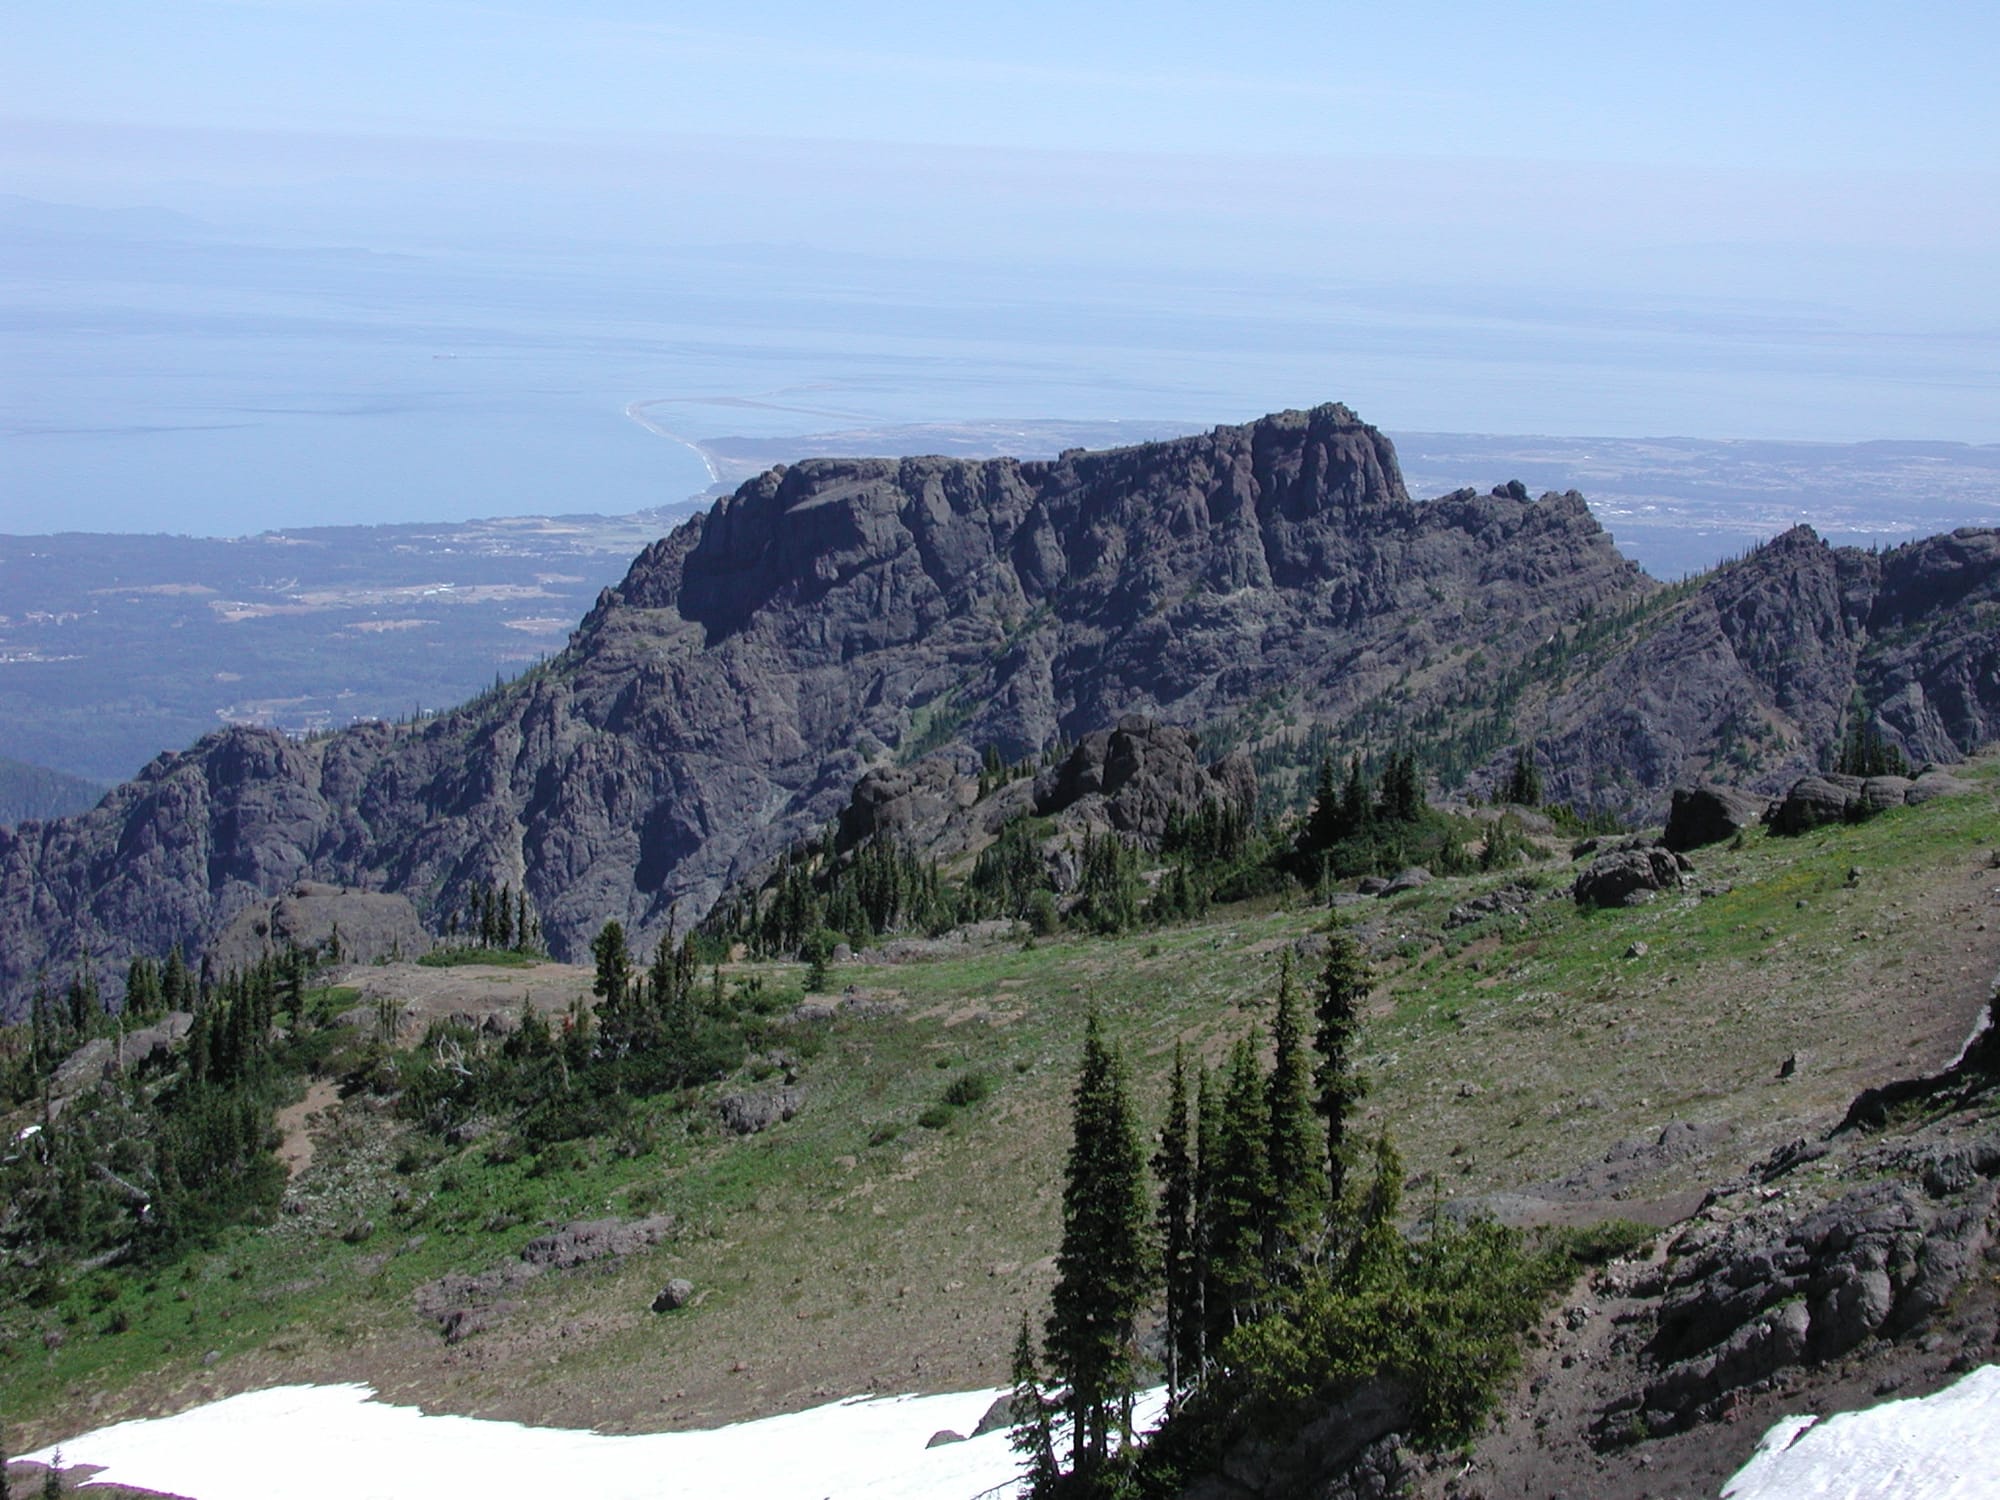
The Obstruction Point Road story isn't just an abstract metaphor I plucked out of thin air. Weather permitting, I can look out my window right now and see where the ridgeline meets Obstruction Peak. I’ve snowshoed across that road in the winter and Grandview Ridge is one my favorite hikes. Nothing beats eating your lunch on the same pristine shale and scree slopes the bulldozers couldn't conquer.
I figure if you’ve successfully plowed your way through my technical documentation, you’ve earned a peak view of your own. (And as promised in the title, I can expense the gas for the trip.)
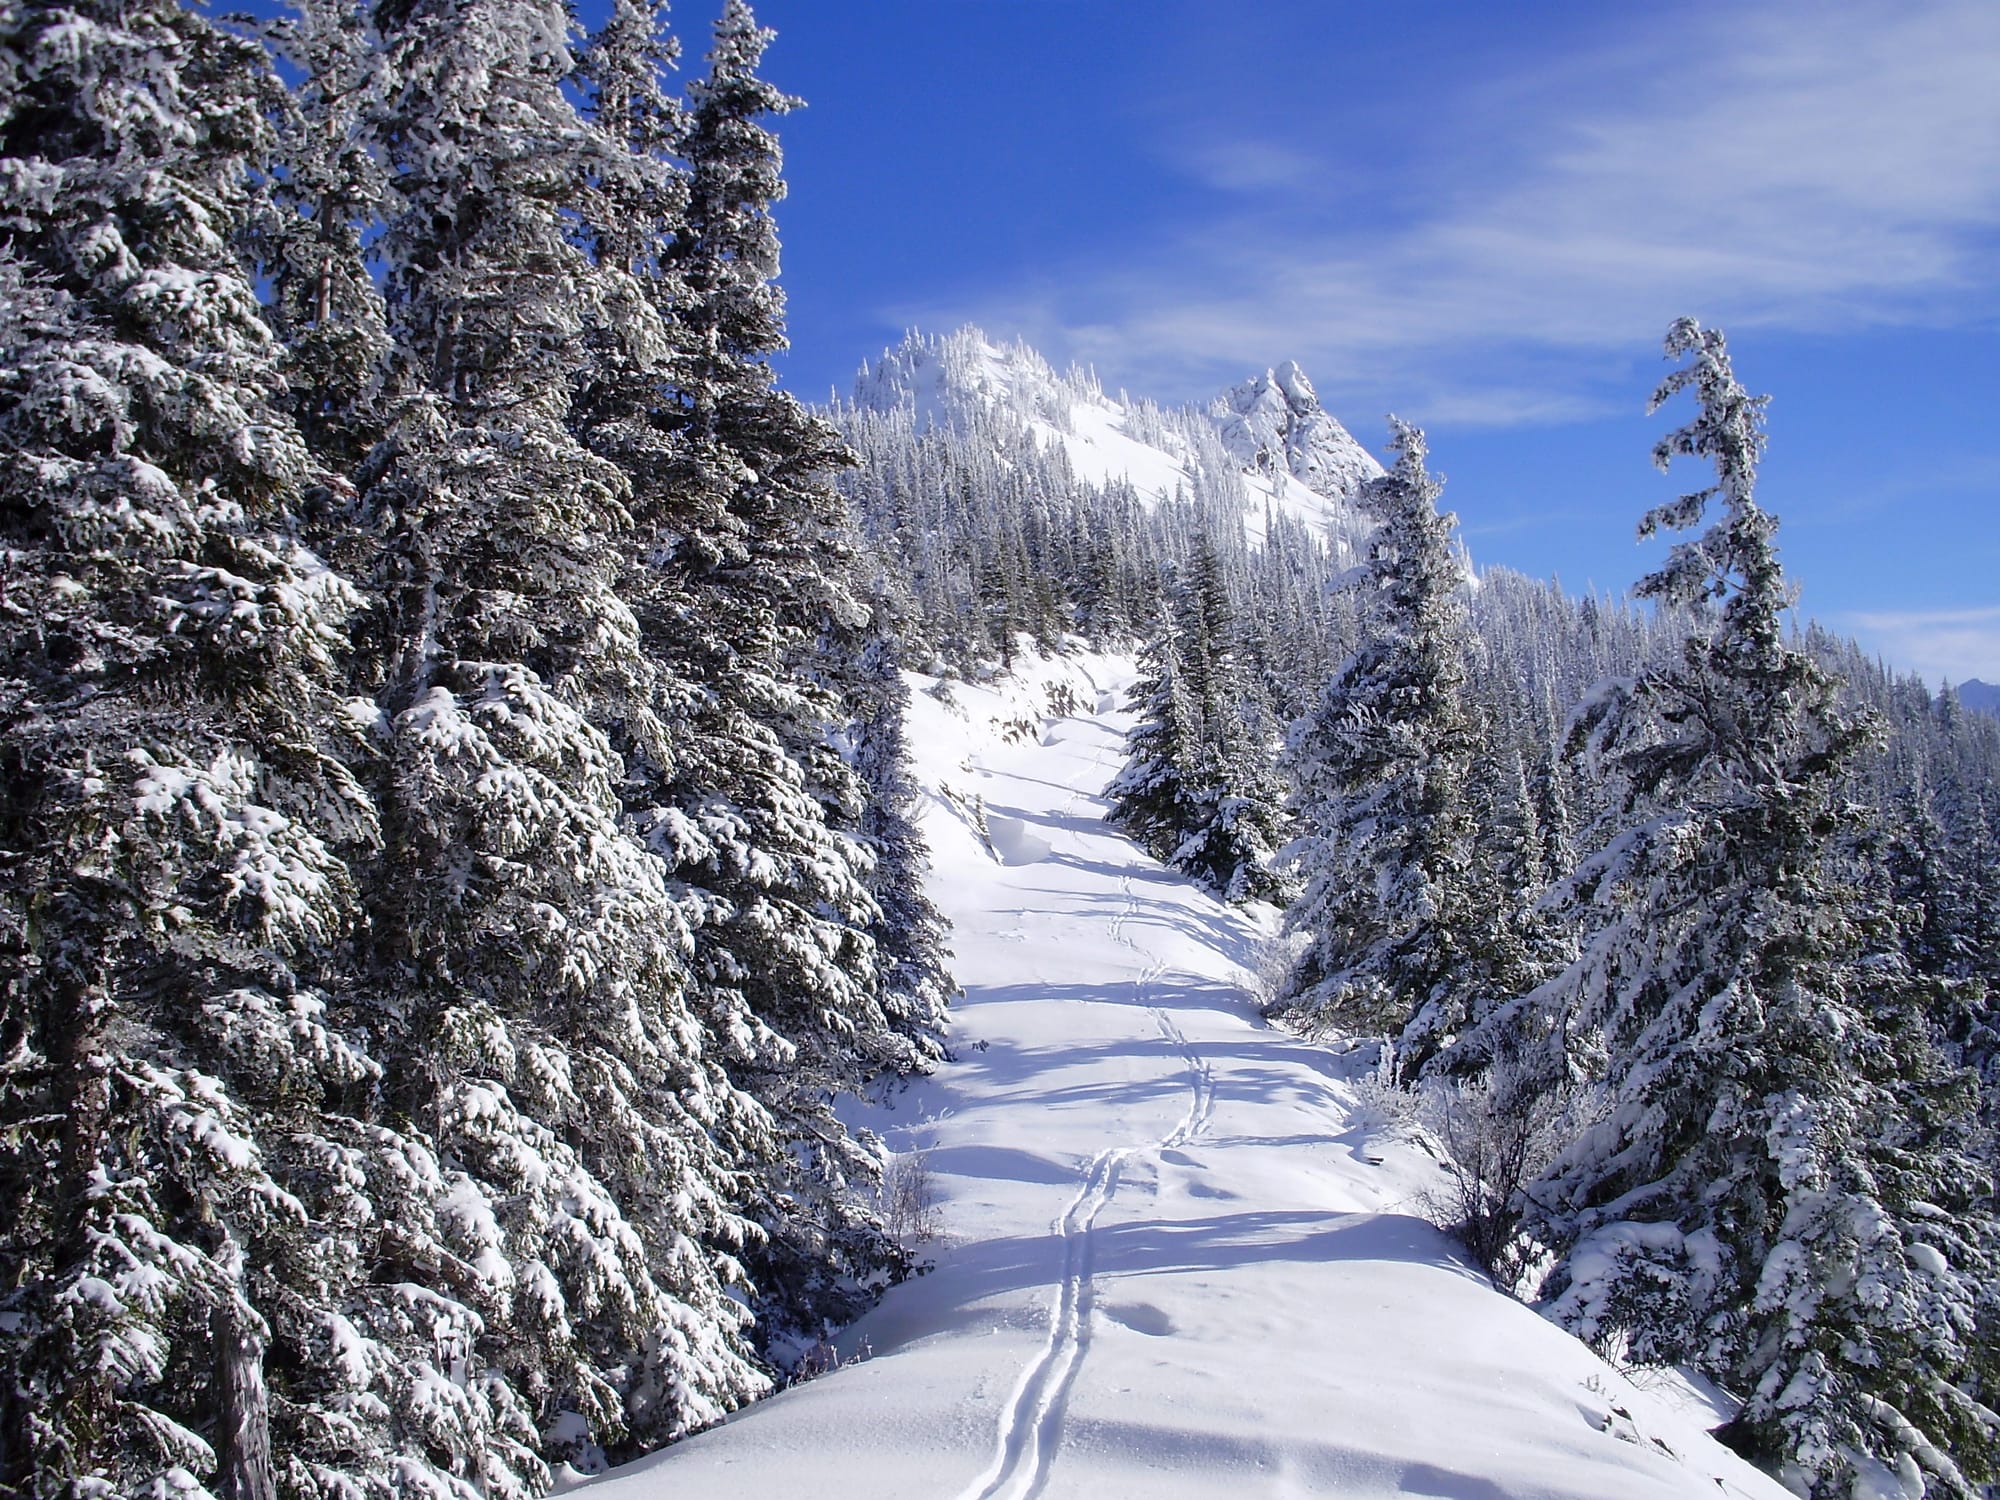
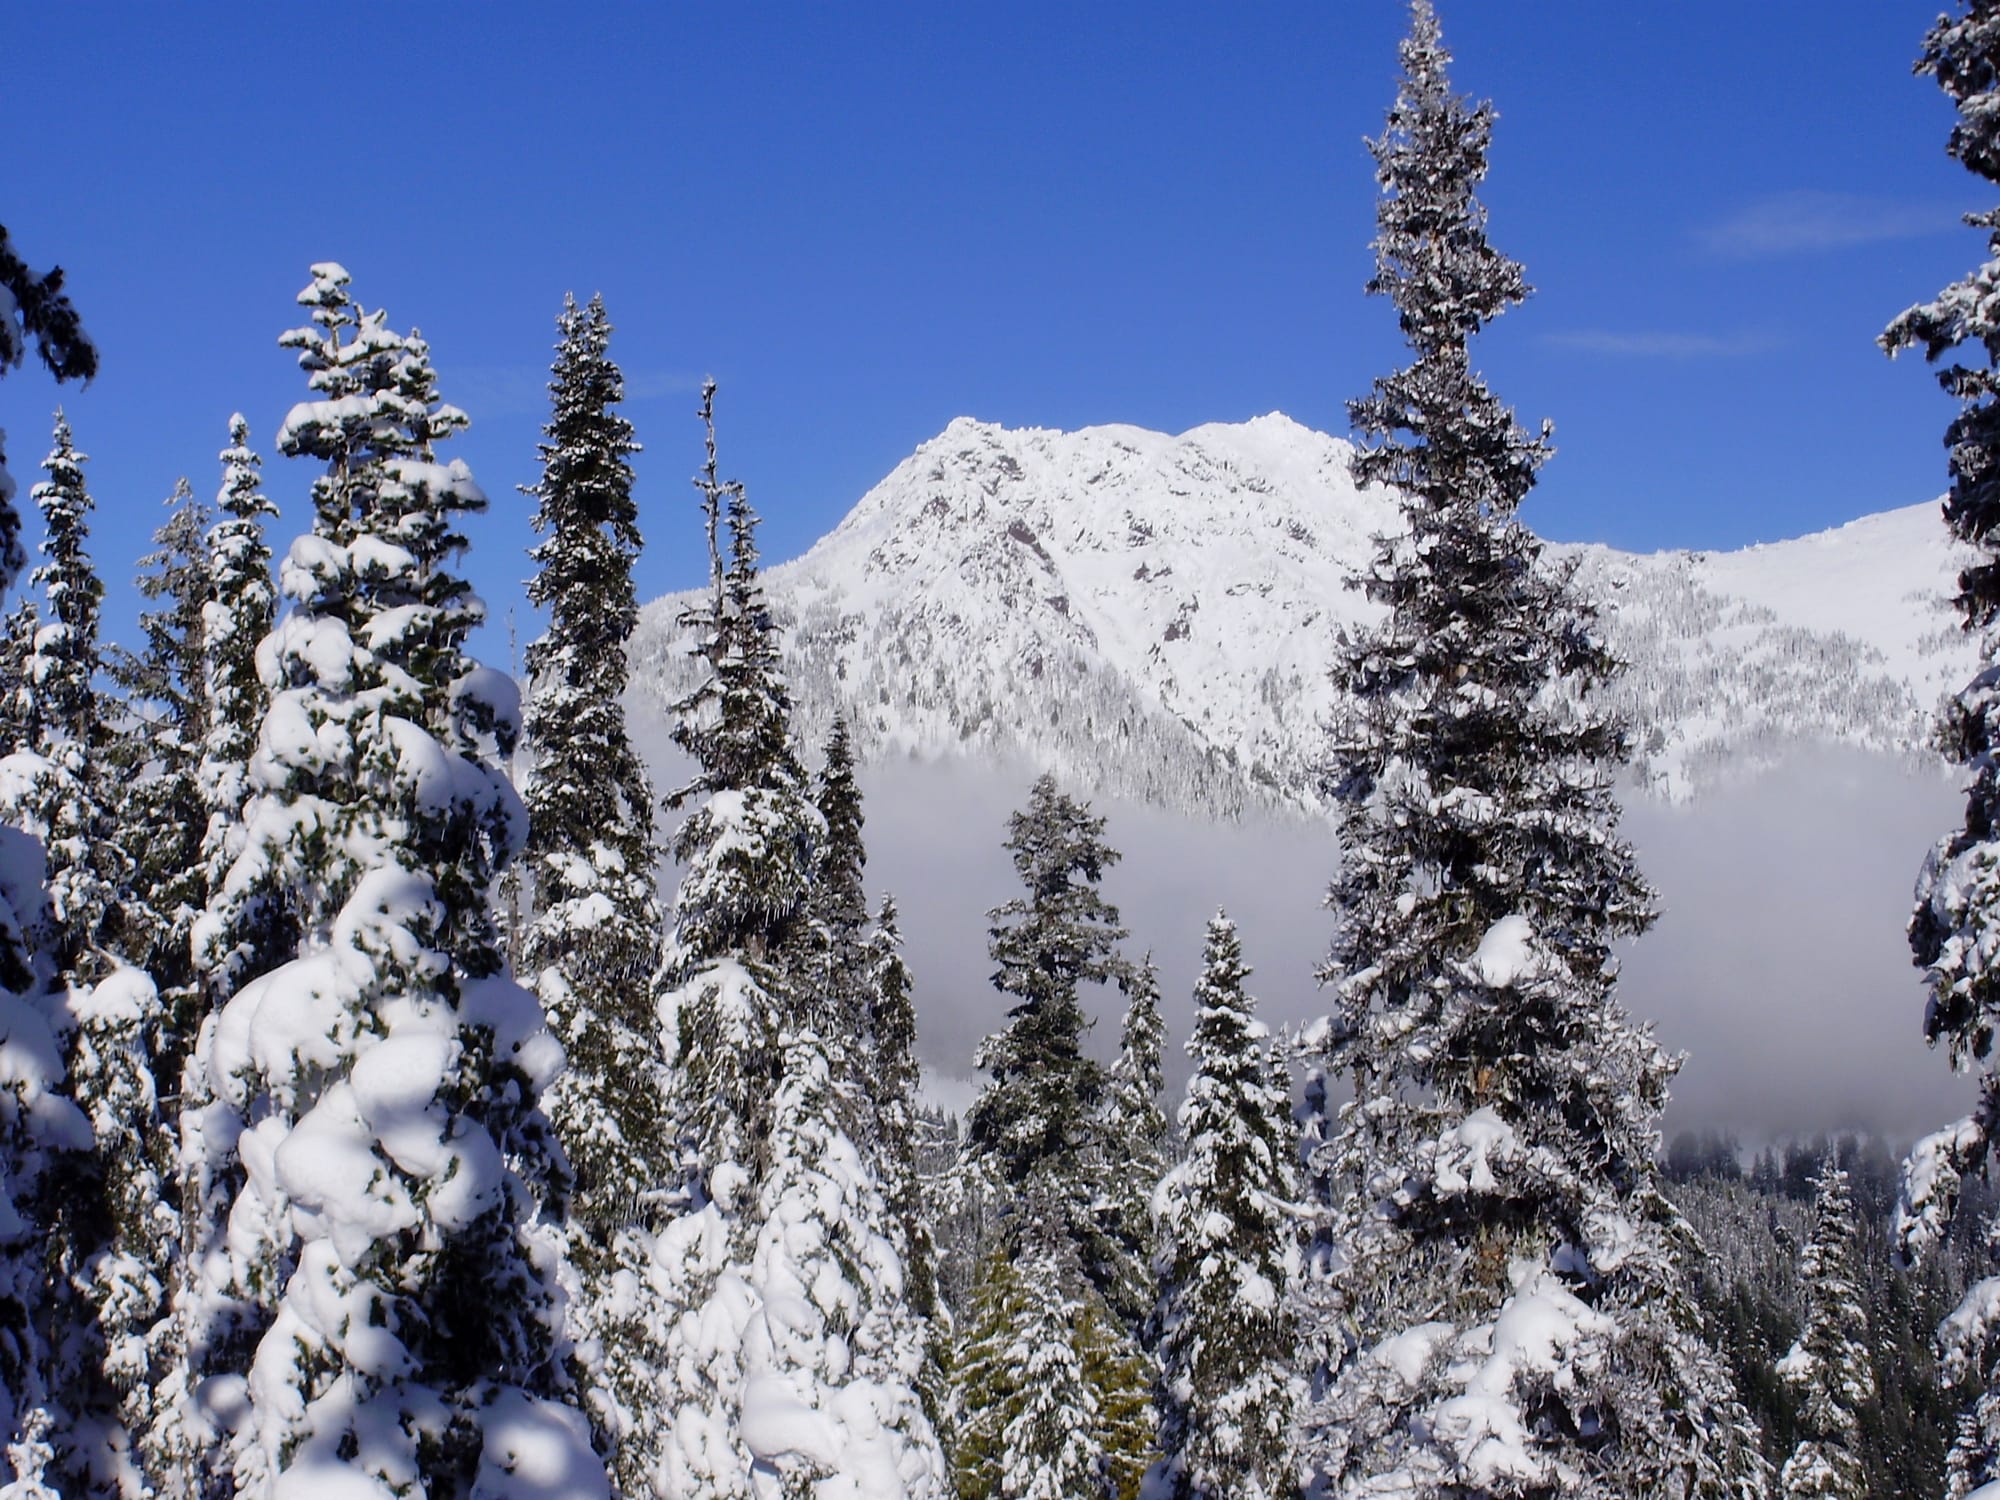
Enjoy the photo gallery below. The winter shots are from a snowshoeing trek while the road was closed to vehicles. The rest are from my various hikes along the east side of Obstruction Peak—a place that's deeply inhospitable to heavy machinery, but perfect for the local cougars.